Is A Stock Bubble Bursting?
-

-

Published Friday, September 4, 2020, 9:15 PM EST

(Friday, September 4, 2020, 9:15 PM EST) Is a stock bubble bursting?
No, the market plunge does not appear to be a bubble bursting. Here's why.
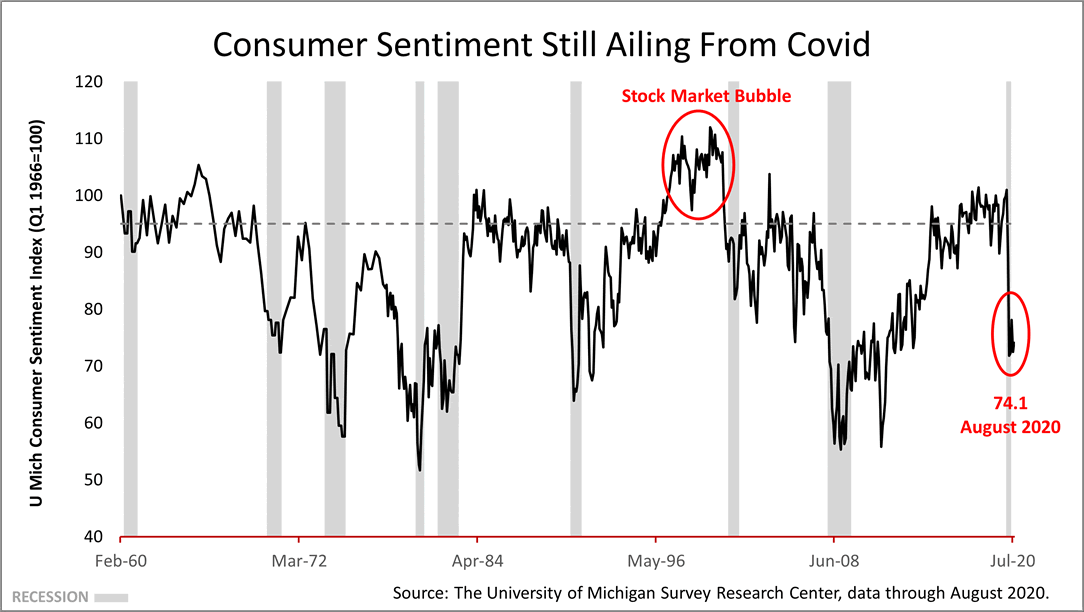
Consumer sentiment is still ailing. At 74.1, consumer sentiment is still in the dumps. It's way off the average rate shown in the dotted line. Its weak condition belies the notion that last week's market downward volatility was a bubble about to burst. To float a price bubble in stock prices, irrational exuberance must be widespread. The 74.1 reading in the consumer confidence poll, conducted monthly by the University of Michigan for decades, is nothing like the 112-plus sentiment readings that characterized the tech bubble of 2000.
Covid crushed consumer confidence starting in March and April. A recovery is in progress, but no widespread irrational exuberance has driven stock prices, causing this past week's decline.
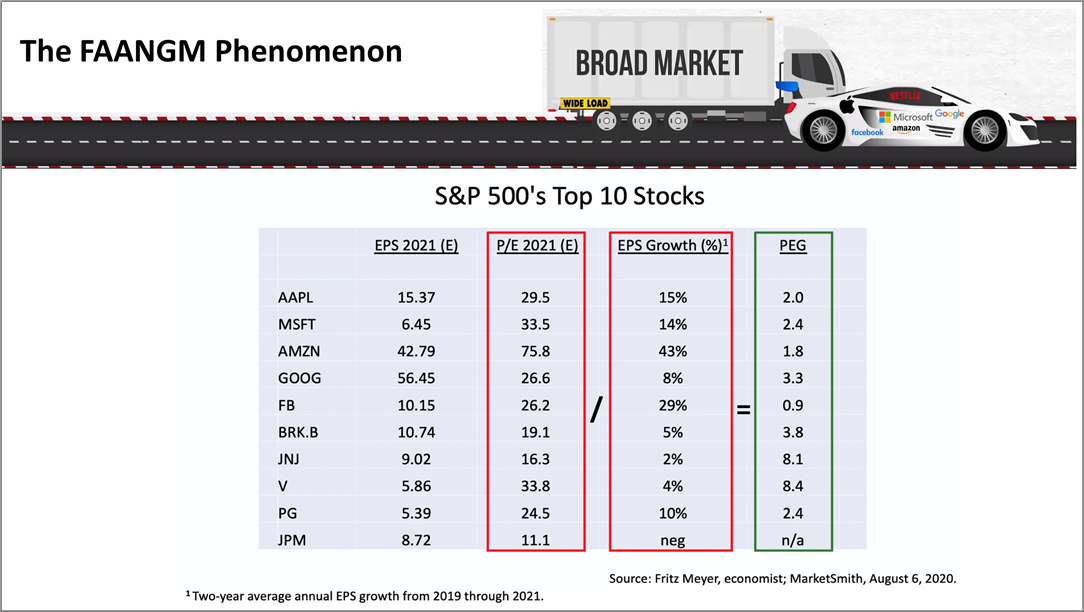
The PEG ratio – price-earnings to growth ratio -- is a company's price-to-earnings (P/E) ratio divided by the growth rate of its earnings. It is a more thorough metric than a standard P/E ratio. The PEG ratios of the top 10 public companies, which drive the performance of the major stock market indexes, were not outlandish before the big plunge this week, and their lead in recovering from Covid was cut back. Since the FAANGM – Facebook, Amazon, Apple, Netflix, Google, and Microsoft – have lead the recovery from Covid and the major market indexes are heavily influenced by market capitalization, their outsized returns have blown away the broad market.
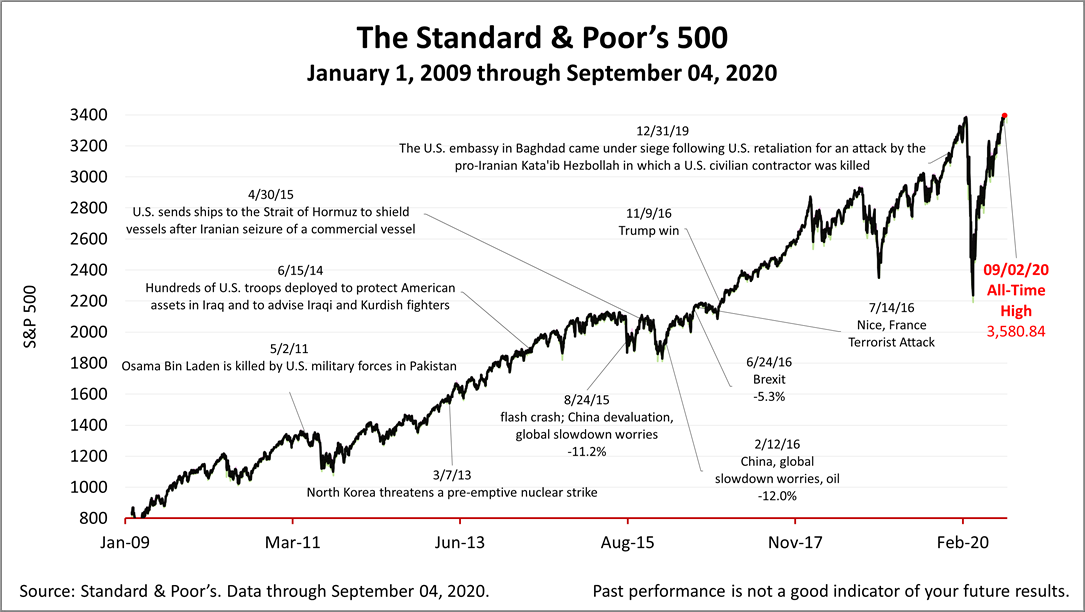
The Standard & Poor's 500 stock index closed Friday at 3,426.96. The index had fallen -3.5% on Thursday and plunged another -3.1% Friday before recovering to close at 3,455.06. That's -2.33% lower than last Friday's close, but +42% over the March 23rd bear market low.
This past week saw a new all-time high for the S&P 500, as well as the largest single-day drop since June 11th. Stock prices have swung wildly since the coronavirus crisis started in March and volatility is to be expected in the months ahead.
The Standard & Poor's 500 (S&P 500) is an unmanaged group of securities considered to be representative of the stock market in general. It is a market-value weighted index with each stock's weight proportionate to its market value. Index returns do not include fees or expenses. Investing involves risk, including the loss of principal, and past performance is no guarantee of future results. The investment return and principal value of an investment will fluctuate so that an investor's shares, when redeemed, may be worth more or less than their original cost. Current performance may be lower or higher than the performance quoted.
Nothing contained herein is to be considered a solicitation, research material, an investment recommendation, or advice of any kind, and it is subject to change without notice. It does not take into account your investment objectives, financial situation, or particular needs. Product suitability must be independently determined for each individual investor.
This material represents an assessment of the market and economic environment at a specific point in time and is not intended to be a forecast of future events or a guarantee of future results. Forward-looking statements are subject to certain risks and uncertainties. Actual results, performance, or achievements may differ materially from those expressed or implied. Information is based on data gathered from what we believe are reliable sources. It is not guaranteed as to accuracy, does not purport to be complete, and is not intended to be used as a primary basis for investment decisions.
This article was written by a veteran financial journalist based on data compiled and analyzed by independent economist, Fritz Meyer. While these are sources we believe to be reliable, the information is not intended to be used as financial advice without consulting a professional about your personal situation. Indices are unmanaged and not available for direct investment. Investments with higher return potential carry greater risk for loss. Past performance is not an indicator of your future results.
2022
-
 Despite Bad Economic News, Stocks Rose 4% In The Week Ended July 29, 2022
-
 Amid Bad Data Releases, Leading Economists Predict No Recession
-
 Good News: Real Retail Sales Dropped Fractionally In The Past Year
-
 Financial Economic News Analysis
-
 Odds Of A Soft Landing Shrunk After Friday's News
-
 Bad Inflation Surprise Sends Stocks Down Sharply
-
 It Could Be A Long, Hot Summer For Investors
-
 What A Difference A Week Makes
-
 Amid Stock Market Turmoil, +2.3% Growth Projected In 2022
-
 Staying On Track Amid The Ukraine And Inflation Crises
-
 For Investors, 2022 Is Turning Into A Test
-
 Is The Economy Brightening? Or Is The Federal Reserve Slamming The Door On Growth
-
 Perspective Amid A Moment Seeming Fraught With Investment Risk
-
 Two Years After The Pandemic Began
-
 Turning The Page On A Dark Period In History
-
 Russia-Ukraine War Erupted And Inflation Worsened But Outlook Drove Stocks Higher For The Week
-
 Investment Perspective Amid Risks Of Fed Tightening, Covid Variants, And European War
-
 S&P 500 Lost -1.9% Friday; Latest U.S. Economic Data Are Strong
-
 January Job Formation Figures Crushed Expectations, Amid A Shortage Of Workers
-
 S&P 500 Closed Up 2.4% Friday After A -10% Correction
-
 Stocks Declined Sharply, Even As Economists Expect 3% Growth In 2022
-
 Should You Care About Wall Street Stock Market Predictions?
-
 Weekly Economic Update For Investors


")